
I'm
Gustavo Oliveira
Data Analyst, Analytics, Power BI, SQL, Microsoft Fabric, Databricks, Python
Build and sustain KPI definitions, ownership, and governance—so executives trust the numbers and teams act on the same source of truth.
Design SQL/Python transformation layers and pipelines on Fabric/Databricks to consolidate sources into reusable datasets for analytics and automation.
Automate recurring reporting and narrative insights using Power Automate and Python, and build Copilot Studio assistants for KPI Q&A and workflow guidance.

Data Analyst with 4+ years of experience delivering business intelligence, operational analytics, and executive reporting. Strong background in Power BI, SQL Server, Python, Microsoft Fabric, and Databricks — translating complex data into actionable insights.
Estácio University, Brazil | Completion: 2025
Foundations in process improvement, operational management, leadership, and performance governance.
Several institutions | 2021 - 2026
Hands-on training to strengthen end-to-end analytics delivery—from KPI design and semantic models to transformation layers, automation, and executive-ready reporting.
Vero Internet | Sep 2023 – Present
Executive-ready dashboards and KPI frameworks for productivity, backlog, churn risk, and service quality.
SQL-first transformation layers and pipelines to consolidate large operational datasets with performance and reliability.
Automation of reporting and workflows to reduce manual effort and improve operational speed.
Validation rules, monitoring, and metric governance to increase trust in executive reporting.
Deep telecom operations context to build analytics that reflect real-world processes and constraints.
Clear storytelling and stakeholder collaboration to turn requirements into actionable analytics products.

Executive-ready operational reporting that consolidates productivity, backlog, SLA, and service quality into a single, decision-focused view for regional leadership.
View Project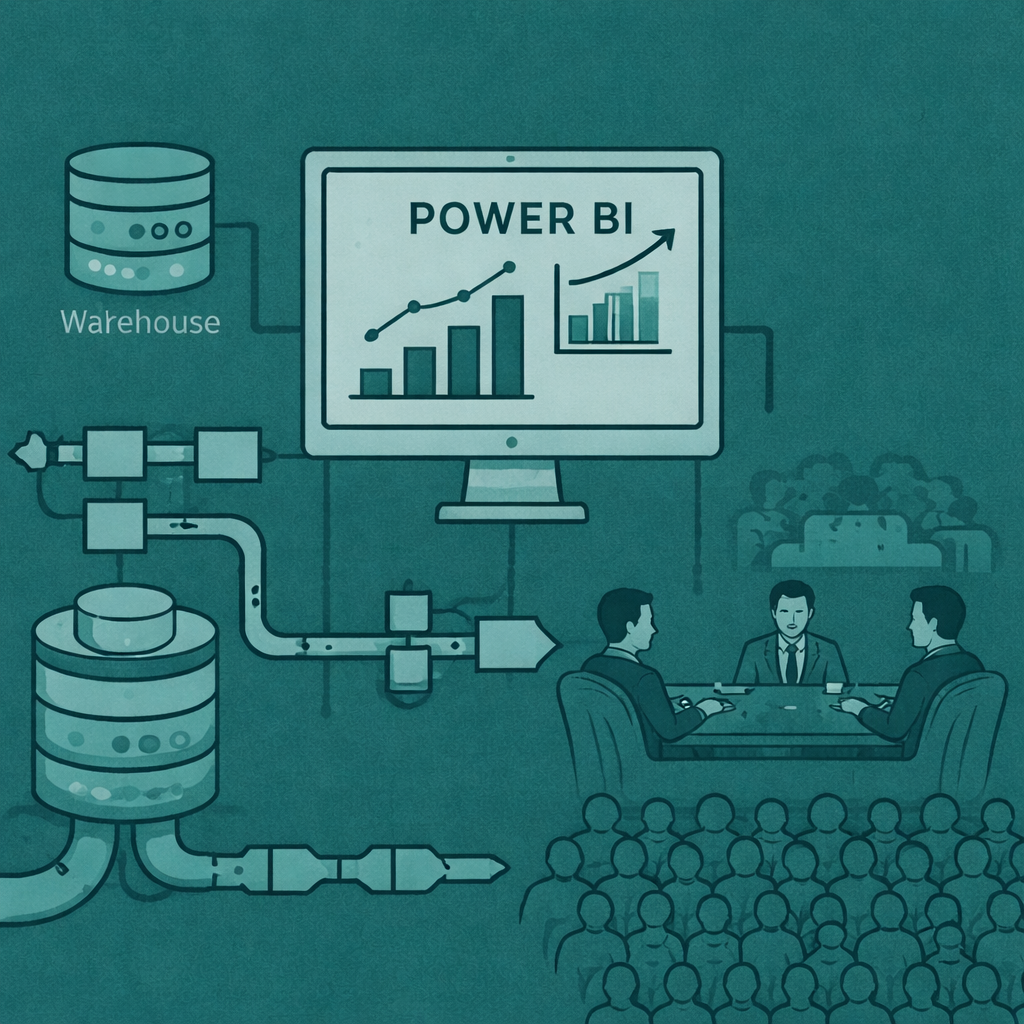
Rebuilt the executive KPI ecosystem for an Engineering & Operations board supporting 1M+ customers—standardizing definitions, improving trust in metrics, and delivering Power BI reporting on Microsoft Fabric (Warehouse, Lakehouse, pipelines/flows).
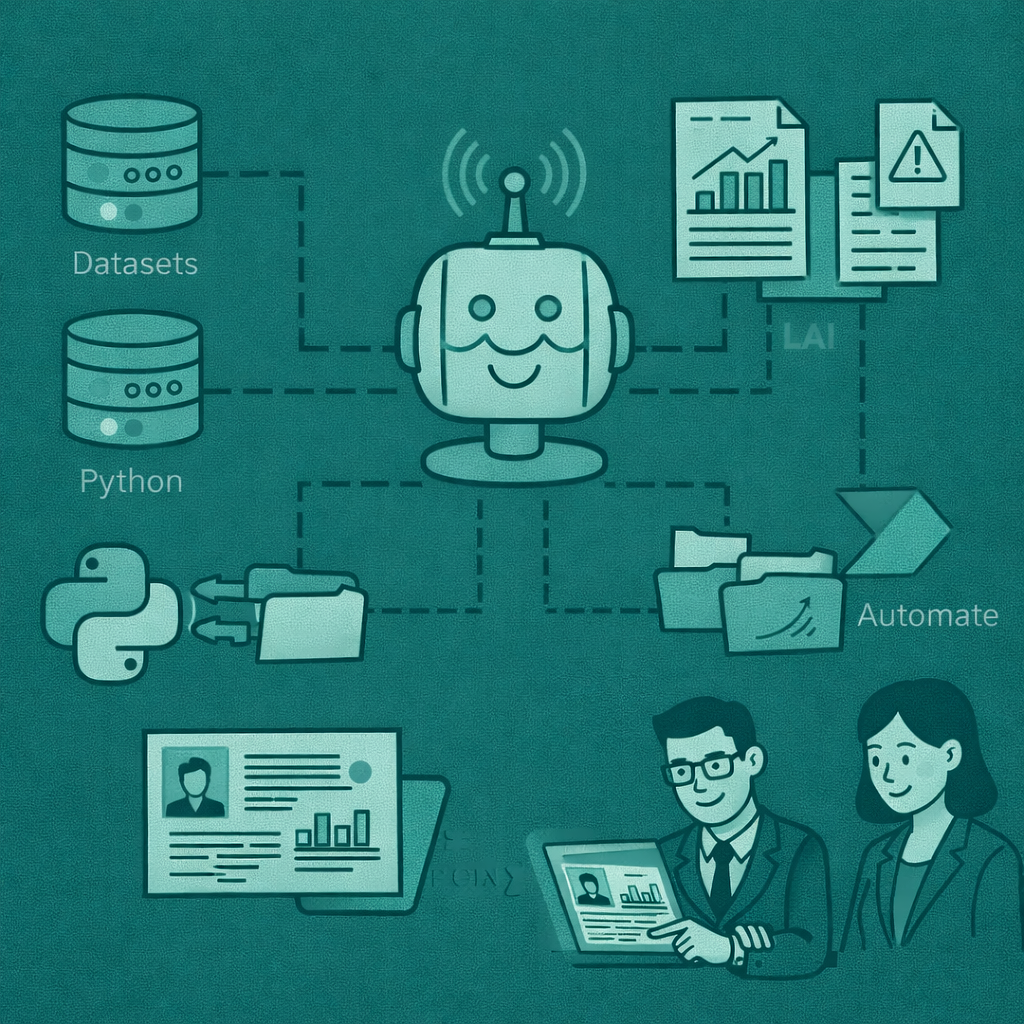
Automated daily KPI analysis and narrative insights using AI, then distributed the bulletin to executives and supervisors via Power Automate—powered by Fabric datasets and Python for validation, ranking, and anomaly detection.
© Gustavo Oliveira. All Rights Reserved.